Peter Burns, with contributions from Tom Rieger and Don Williams
The following is an update to our presentation at this year’s Archiving Conference in Boston [1]. We present some imaging performance results for an Apple iPhone 18 Pro Max unit. For comparison, we also include some results for an iPhone 16 Pro Max. A PDF version of this report is here.
Background; Previously, we examined the potential of contemporary mobile devices, particularly smartphone cameras, to support large-scale digitization of cultural heritage. We also described how automated metadata generation and digital collection systems can complement mobile capture. When testing the imaging performance of several mobile-device cameras, we noted limitations, such as nonuniform illumination and inconsistent sharpness across captured images.
Caution: The following results are based on single units under test, which we will refer to as iPhone 18, and iPhone 16, in a single evaluation each. A range of illumination and camera settings were not used, so these results may not be representative of all situations and applications. So, let’s not run too far with these results. That said, we used the same testing methods and analysis software as for our previous study. Tom Rieger captured the images, and Peter Burns and Don Williams completed the analysis and plotted the results.
Testing and Results
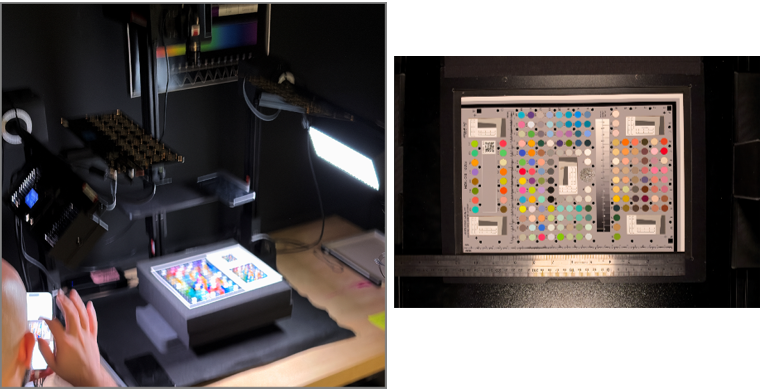
Recently, T. Rieger completed a limited test of two iPhone models using a copy stand and FADGI ISO 19264 test target, as before. This iPhone 16 was used in our previous study. Figure 1 shows a similar testing setup, from Ref. [1], and the iPhone 18 test target image. The test images were captured as raw Adobe RGB (1998) encoded, 16-bits per channel. We will limit our reporting to two performance measures. The object sampling was 420 pixel/inch.
Color Encoding Accuracy
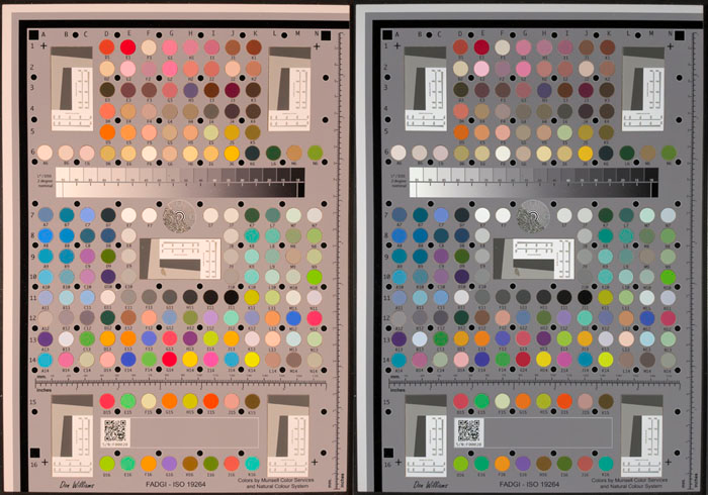
We used ΔE00 as the color-goodness measure, consistent with the FADGI Guidelines. [2] For this test image, applying a custom ICC color profile based on the FADGI target colors significantly improved the color accuracy measure. Figure 2 shows the results for the iPhone 18 test image, 50 megapixels each. We can see a clear color cast in the input test, often due to the capture illumination rather than the camera. The color profile significantly reduced this, as we would expect.
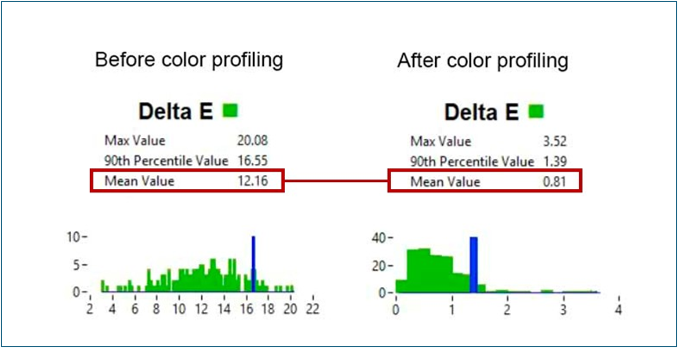
The corresponding color differences for the patches are summarized in Fig. 3. Each difference is computed between the input test target patch CIELAB values and those for the image values computed from the Adobe RGB values. The analysis and histogram reporting were done using Golden Thread software [3].
Spatial Frequency Response
The method used to measure the capture of object or scene details by a camera is the Spatial Frequency Response (SFR). This method analyzes edge features per ISO 12233, which is used under FADGI. For this analysis, we compare results from the iPhone 18 with those from the iPhone 16. We tested both devices under the same conditions.
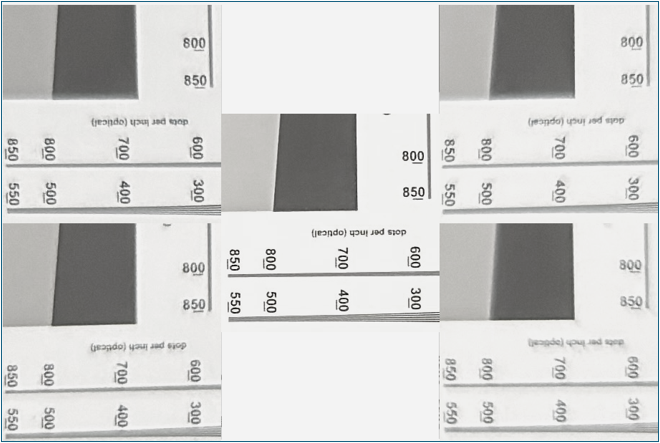
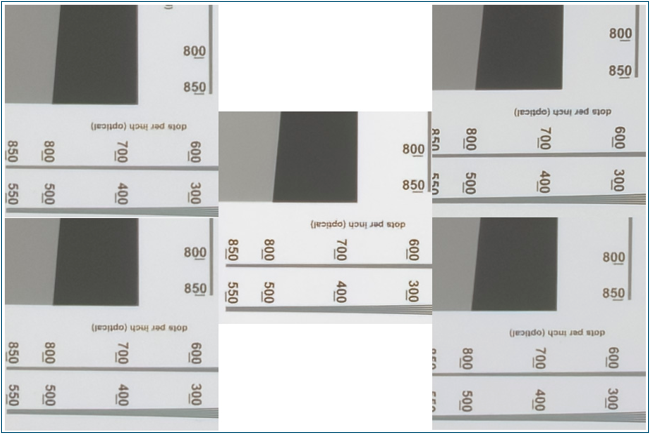
Figure 4 shows cropped regions for the iPhone 16 test image. Note that these regions only show example edges in the vertical orientation for illustration. The four corner regions were located near the 50% of the image field of view, as shown in Fig. 1. As in our previous study, we see a falloff in image detail and apparent sharpness near the edges of the image field. In addition, the center edge over- and undershoot seen here are often due to digital sharpening. The corresponding image areas for the iPhone 18 are shown in Fig. 5. Note the generally consistent, sharp features across the image.
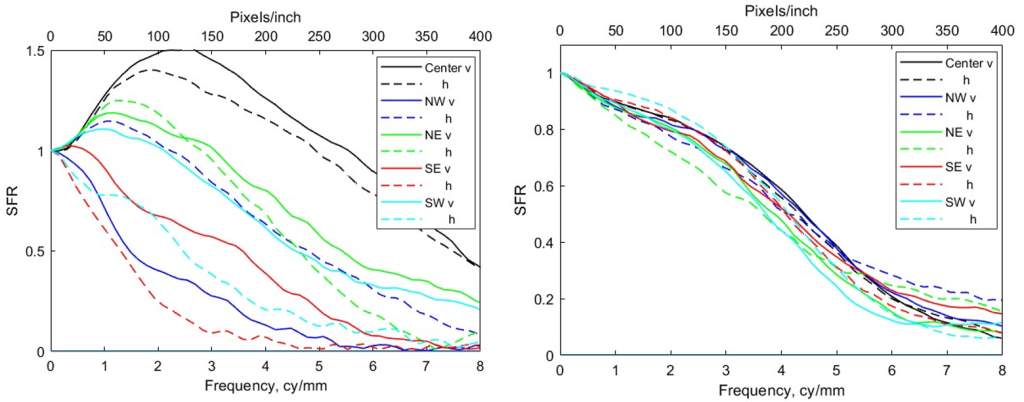
The SFR analysis was performed for both vertical and horizontal edges in these areas. These results were computed using the SFRMAT5 Matlab function that is part of ISO 12233 [4]. The results for the iPhone 16 and 18 are shown in Fig. 6. The five locations are: Center, northwest (NW), northeast (NE), southeast (NE), and southwest (SW). The high SFR values for the iPhone 16 center are consistent with the above observations of Fig. 4, as are those for the iPhone 18, where significantly more uniform behavior is evident.
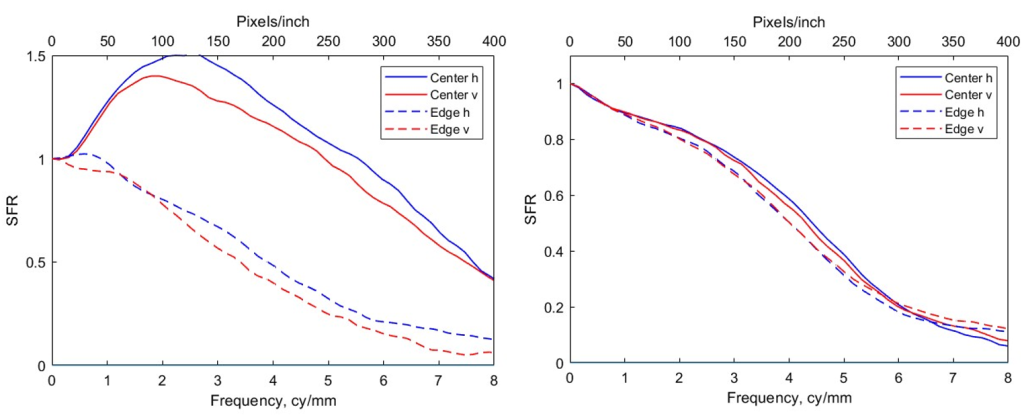
We can further summarize this intra-image performance by comparing the center and edge performance. This is shown in Fig. 7. The edge results are the mean SFR for the four regions near the corners (50% field of view) of the test target.
Summary
The results of our brief evaluation showed more consistent imaging performance across the image field than we have observed for most other devices, including the iPhone 16. We intend that this and related performance evaluations contribute to efforts in field acquisition for digital preservation and collections. A PDF version of this report is here.
Acknowledgement: Thanks to our co-authors in Ref [1]; Dean Serrentino, Lilli. Cooper, Michael. Sao Pedro, Jay Bosanko, Juilee Decker. This is why we go to conferences.
References
- D. Serrentino, P. Burns, L. Cooper, M. Sao Pedro, J. Bosanko, J. Decker, D. Williams, and T. Rieger, Mobile Imaging and Metadata Capture for Cultural Heritage Preservation, Proc. Archiving Conference, 2026, IS&T, pp. 18 – 23. https://library.imaging.org/archiving/articles/23/1/5
- FADGI Still Image Working Group, ed. T Rieger, US Library of Congress, http://www.digitizationguidelines.gov/
- Golden Thread Software, Image Science Associates, https://www.imagescienceassociates.com/
- P. D. Burns, K. Masaoka, K. Parulski, D.Wueller, Updated Camera Spatial Frequency Response for ISO 12233, Proc. IS&T Int’l. Symp. on Electronic Imaging: Image Quality and System Performance, 2022, pp 357-1 – 357-6, https://doi.org/10.2352/EI.2022.34.9.IQSP-357