Previously, I presented frequency-domain analysis is applied to recordings, and showed results based on Perseverance Rover audio files released by NASA. Since NASA posted the original (with-Rover) and filtered (without-Rover) versions, we can use these to compute (estimate) the sounds of the Rover itself.
Based on the previous examination, I found
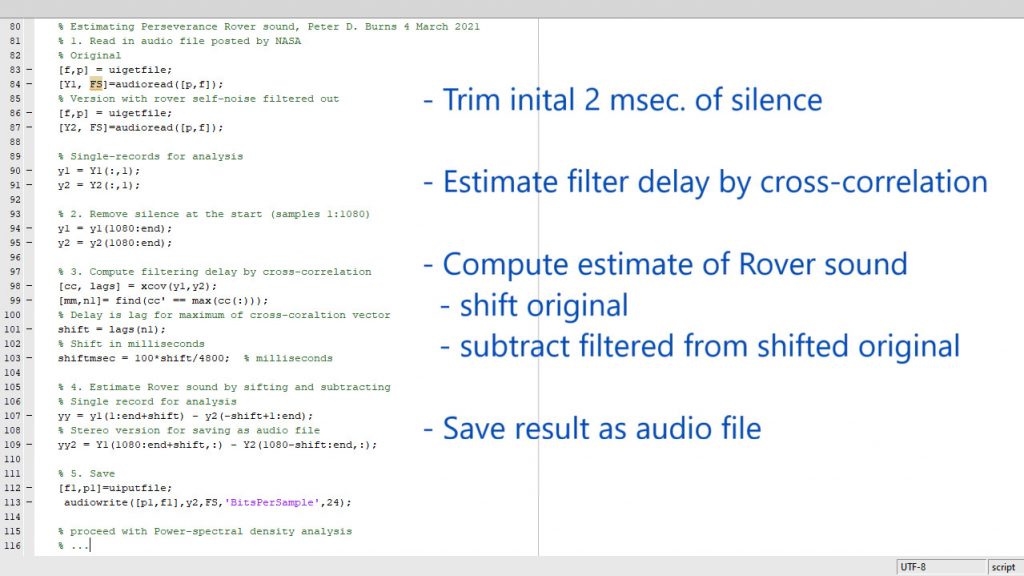
- short silence at the start
- 2 msec. delay due to the filtering (original and filter records were not synchronised)
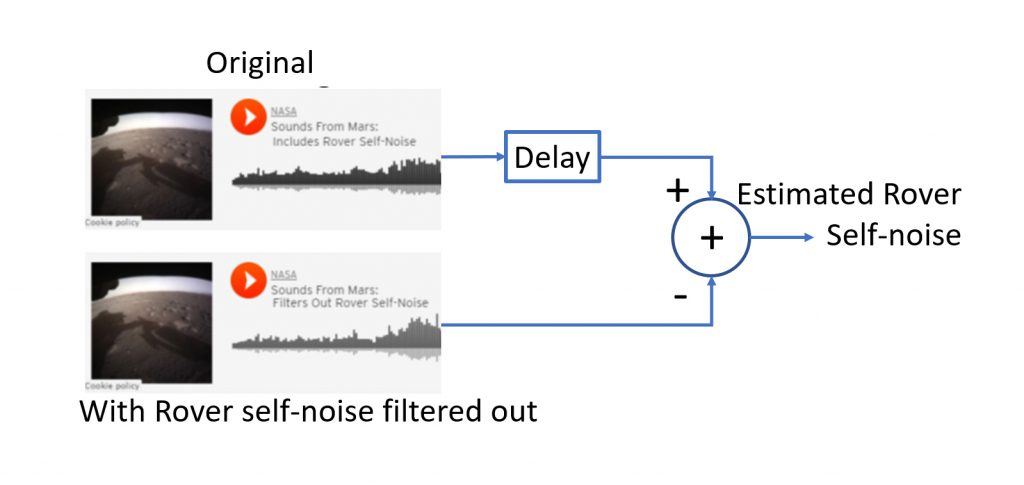
The Estimate: The above diagram shows how the computed Rover sounds were computed. A bit more detail is shown here.
The results are shown below, along with the original and filtered versions.
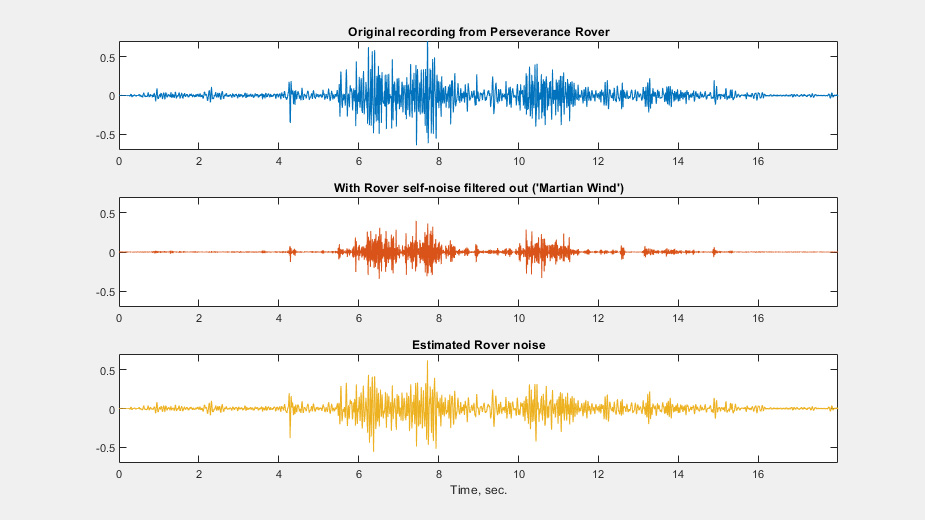
We again note that the components of the apparent Martian atmospheric sounds (at 6-8 and 10-11 sec.) are evident in all records. We can interpret this by saying that the computed signal does not completely isolate the Rover sounds, but this is to be expected.
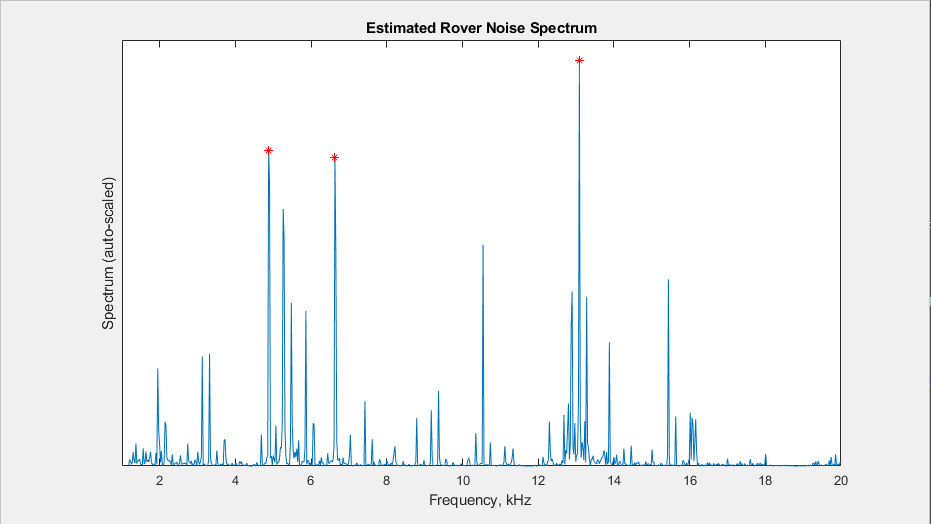
As in Part 1, we can perform the frequency analysis on the computed signal. This is based on a moving window, a length 2000 FFT with a one-third overlap. The results for an example segment are shown.
The video (2.5 min.) includes the spectral analysis, here. (You might want to try it with headphones or earbuds)
Here is a version without me talking, Link
As before, consistent high spikes in the spectra indicate the presence of periodic components (tones) that may be due to, e.g., vibrations, motor rotation, etc. These are seen at 5-7 kHz and near 13 kHz.
– Peter Burns