Don Williams presented our talk at the IS&T Archiving 2021 Conference last week.
Here is the presentation file
Don Williams presented our talk at the IS&T Archiving 2021 Conference last week.
Here is the presentation file
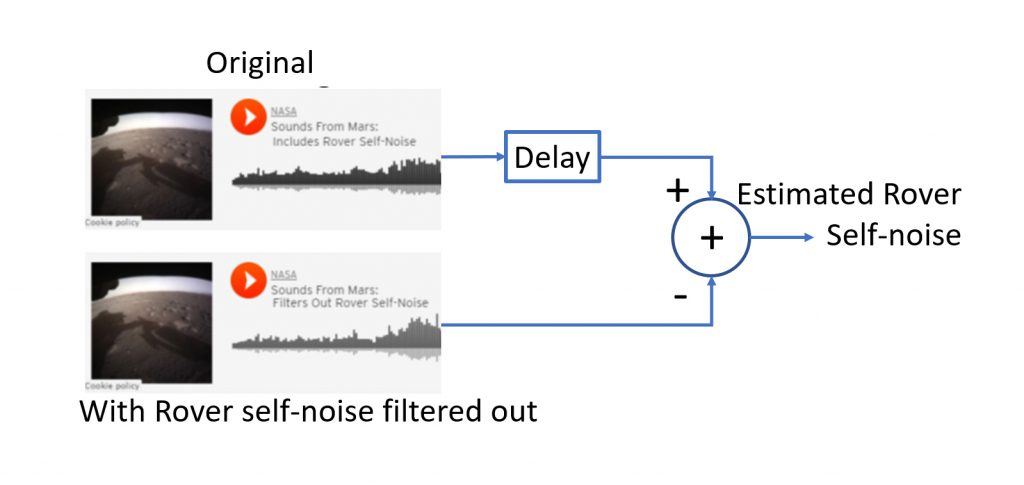
Previously, I presented frequency-domain analysis is applied to recordings, and showed results based on Perseverance Rover audio files released by NASA. Since NASA posted the original (with-Rover) and filtered (without-Rover) versions, we can use these to compute (estimate) the sounds of the Rover itself.
Based on the previous examination, I found
The Estimate: The above diagram shows how the computed Rover sounds were computed. A bit more detail is shown here.
The results are shown below, along with the original and filtered versions.
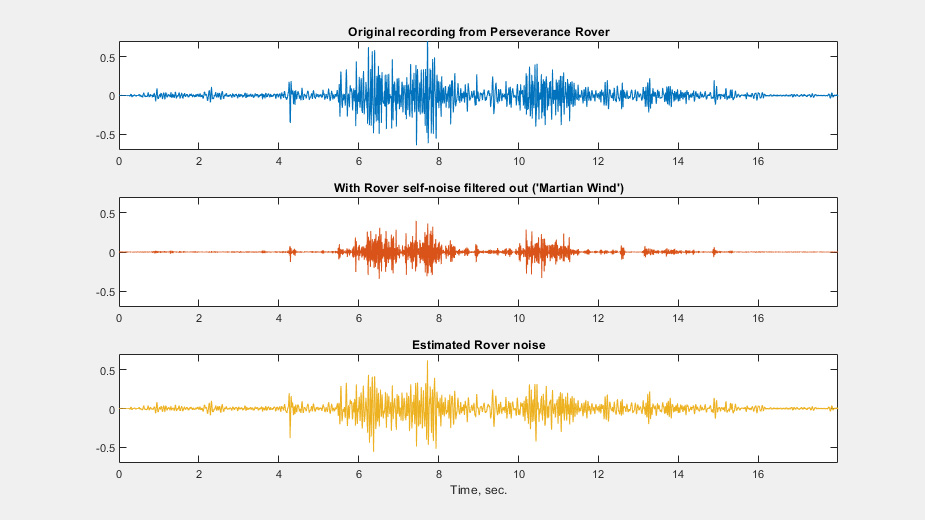
We again note that the components of the apparent Martian atmospheric sounds (at 6-8 and 10-11 sec.) are evident in all records. We can interpret this by saying that the computed signal does not completely isolate the Rover sounds, but this is to be expected.
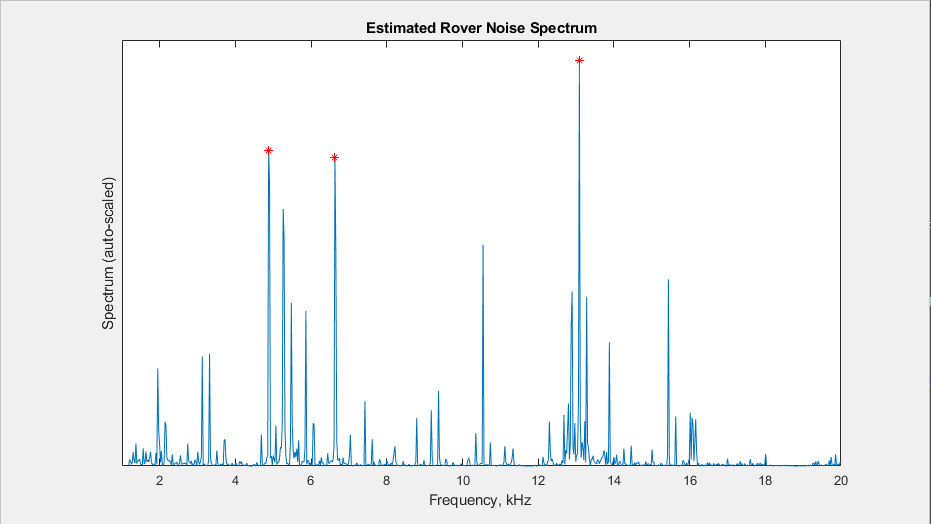
As in Part 1, we can perform the frequency analysis on the computed signal. This is based on a moving window, a length 2000 FFT with a one-third overlap. The results for an example segment are shown.
The video (2.5 min.) includes the spectral analysis, here. (You might want to try it with headphones or earbuds)
Here is a version without me talking, Link
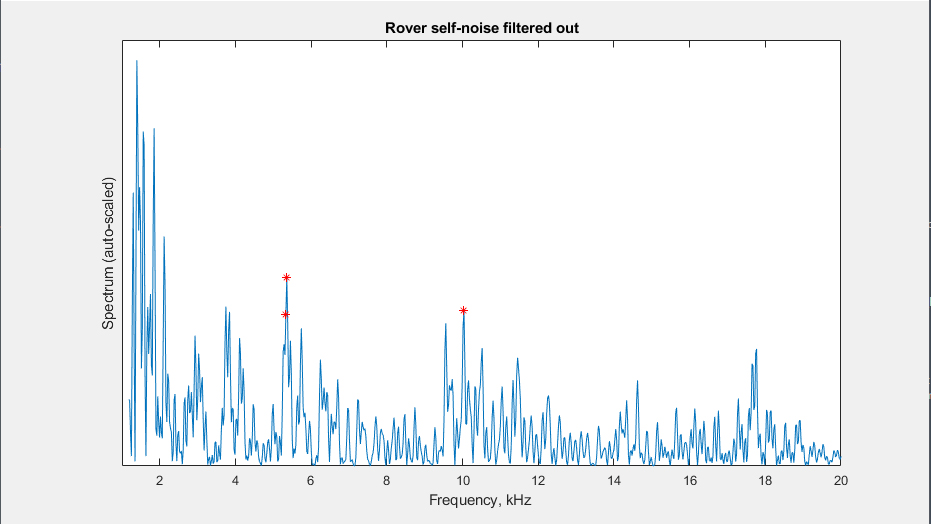
As before, consistent high spikes in the spectra indicate the presence of periodic components (tones) that may be due to, e.g., vibrations, motor rotation, etc. These are seen at 5-7 kHz and near 13 kHz.
– Peter Burns
[ For my technical friends, this may be seen as straightforward. For others, I hope you find this a useful example of the type of analysis that is behind the design and maintenance of many modern products and services]
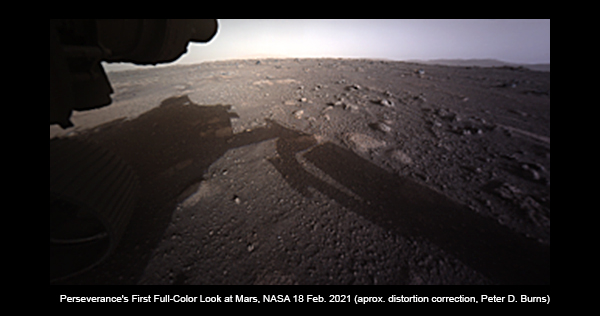
First sounds from Mars: Recently NASA posted the first audio recordings from the Perseverance rover. In order for us to hear the ambient Martian sound, two versions of the audio file were posted;
Commenting on these sounds, Matt Heck suggested that, in general, attaching a microphone to engines is a useful part of monitoring and diagnosis of problems, wear, etc. He also suggested identifying conditions by frequency analysis to monitor resonant vibrations (frequencies). While this is often done in design, it is rare in normal product usage.
Our friend Fourier: A common analysis tool for signals of many kinds is Fourier analysis. Simply put, expressing signal/image content in terms of frequency components is another way to describe them. Whenever you hear someone say, ‘I don’t have the bandwidth to take on that task’, they are (usually inadvertently) giving a nod to the French mathematician, Joseph Fourier* … but I digress.
The Sound of the Machine: Since NASA posted the original (with-Rover) and filtered (without-Rover*) versions, let’s take a look at these signals. The audio signals are plotted here. The clip runs 18 sec., sampled at 48 kHz.
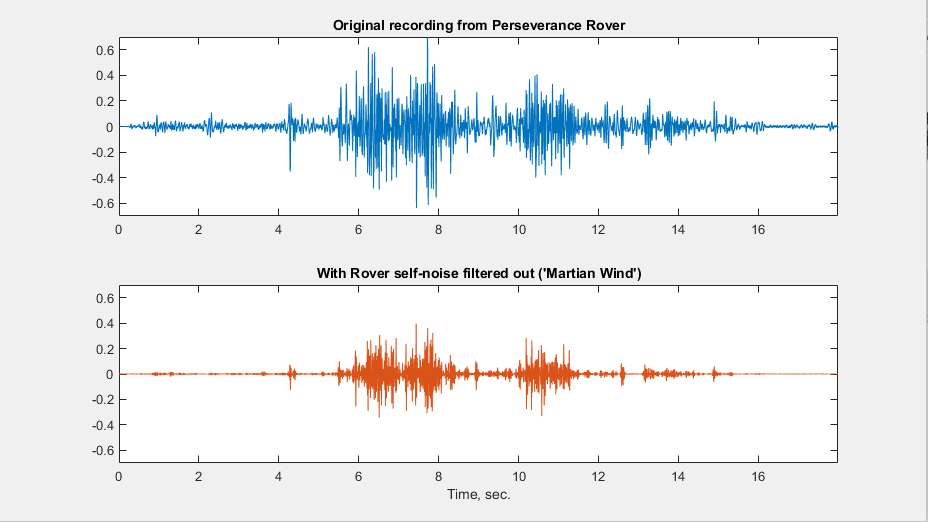
We note that the components of the apparent Martian atmospheric sounds (at 6-8 and 10-11 sec.) are evident in both records. Filtering signals such as these, under field conditions, is naturally challenging and it is not surprising that the atmospheric and machine sounds would not be completely isolated.
Fourier (Frequency-domain) Analysis: Consistent with Matt Heck’s suggestion, I computed the Signal (frequency) spectrum for the estimated Rover sound. [Since the statistics are not stationary, a spectrum based on a moving window is commonly used. In this case, a length 2000 FFT was used with a one-third overlap]
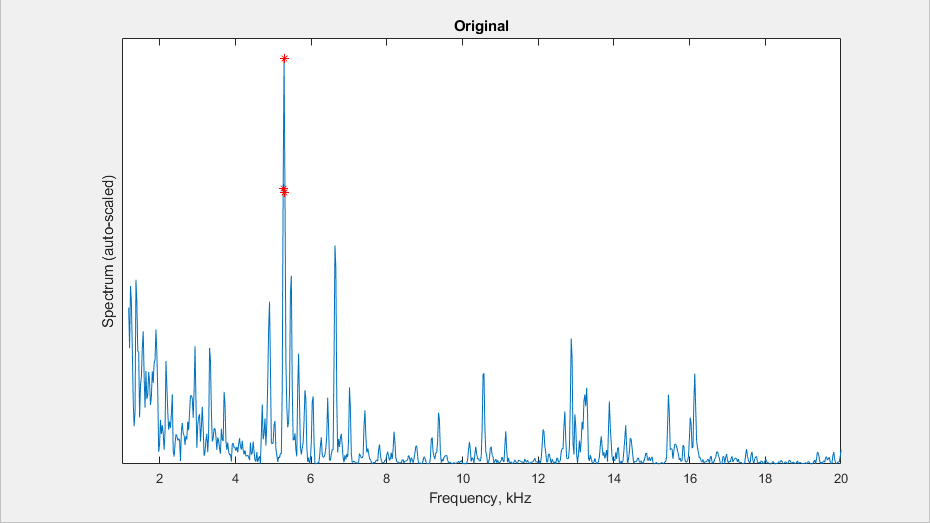
Shown below is the power spectral density (magnitude-squared) for a single half-second record, for both original and filtered versions. I have found the highest three components, as candidates for identification. For simplicity, the y-axes are auto-scaled, so the actual amplitude values for the two plots are different.
Variation: The results of the above analysis are subject to normal signal variation and background noise. So, to get a feel for the consistency (or underlying signature) of, e.g., the characteristic sounds that Matt Heck was referring to, I offer this short video.
The video includes the spectral analysis, here. (You might want to try it with headphones or earbuds)
Here is a version without me talking, Link
Consistent high spikes in the spectra indicate the presence of periodic components (tones) that can be tied to particular mechanisms (e.g., vibrations, motor rotation, etc.). For the original recording, we observe these at 5-7 kHz and near 13 kHz.
Other observations: 0.22 sec. of silence at the beginning, and a small delay (phase-shift) introduced by the filtering.
– Peter Burns
——
* Full name: Jean-Baptiste-Joseph Fourier
A lesson in imaging training, from TV. Amazing what you can pick up from reruns. In this case, Hawaii Five-0, 2013. Episode: Imi Loko Ka ‘Uhane (Seek Within Ones’s Soul)
Story: The Savannah Walker Show: Savannah takes a thrilling ride-along with Hawaii’s elite crime-fighting task force, Five-O. Police officer Kono Kalakaua is played by Grace Park. Savannah Walker is played by Aisha Tyler, with dialogue double, Wendy Pearson.
…
Scene: Hawaii Five-O Tech. Police Lab.
Kono: … so what we did was we took the video you shot and enhanced it in order to get a better look at our suspect, Wo Fat.
Savannah: When you say “enhanced,” what do you mean exactly?
Kono: Uh, well, Five-O is, um, equipped with the latest in digital forensic hardware, which allows us to improve image quality by manipulating zoom, frame rate, um, angle, uh, at the same time increasing resolution.
Savannah: Wow. Who on the Five-O team is well-versed in all this high-tech wizardry?
Kono: Uh, that would be me. (chuckles)
Savannah: How on earth did you get so tech-savvy?
Kono: Xbox.
–
Me: (thinks) um, who knew!
(script courtesy of https://transcripts.foreverdreaming.org)

As part of an effort to modify the IS&T Archiving Conference to an on-line format, I have recorded a video, showing how to do this using PowerPoint. This should be useful for those who are unable to present live via a webinar-type format. It can also be used to record yourself for future editing and posting. (6.5 minutes)
Straight to Video: I used the current version of (Windows) Microsoft PowerPoint. Download here, or stream below.
Other Tutorials: Similar information is available from the following.
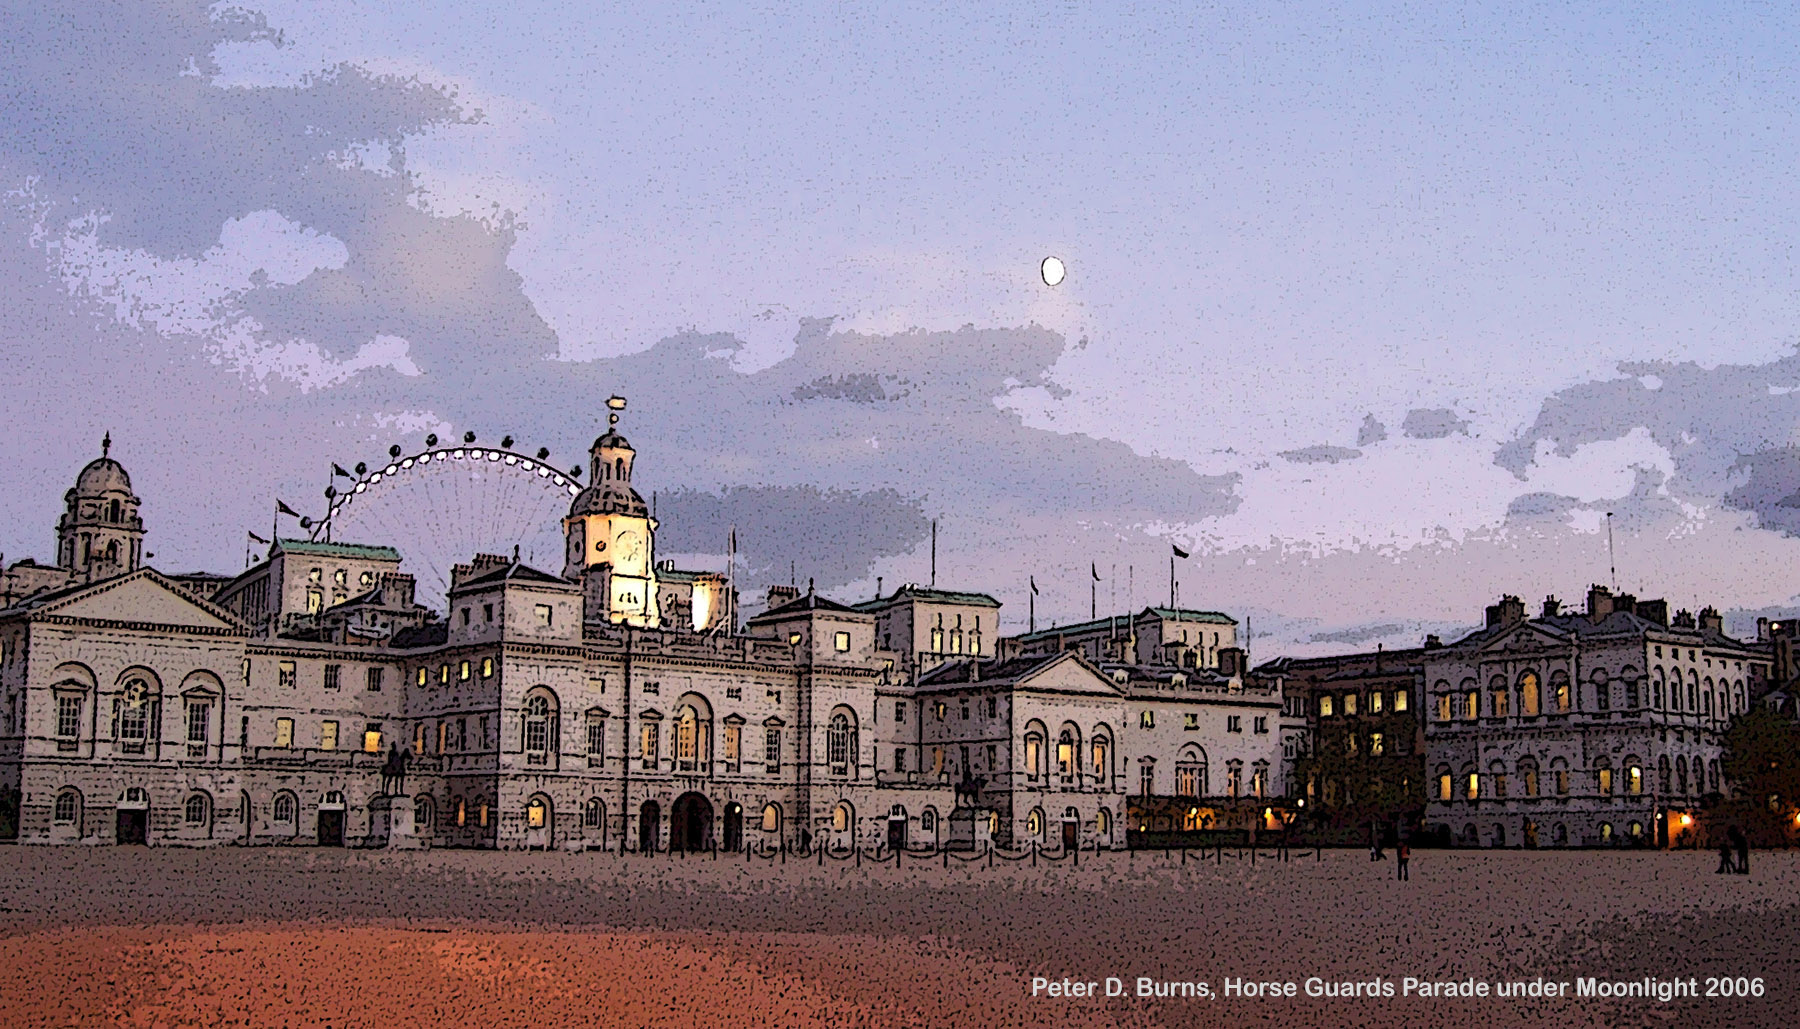
Here is another puzzle based on a photo taken when I visited London to attend the Digital Futures* Conference in 2006. This is Horse Guards Parade under Moonlight. You can see the London Eye, (or Millennium Wheel), observation wheel in the background, across the Thames.
Jigsaw Puzzle: You can choose to display the picture while doing the puzzle.
Picture
______
* Organised by the Royal Photographic Society’s Imaging Science Group.
Many years ago I participated in an imaging conference in London, organised by the Royal Photographic Soc. Walking around in the evening, I found myself returning to Trafalgar Square with my camera. Here is a jigsaw puzzle based on, Trafalgar 1 (2006). I am looking along The Strand, and the building on the left is the South African High Commission. I like the blurred white delivery van in the foreground.
Jigsaw Puzzle: This might be a bit tricky on a mobile phone. In the lower-left of your screen you can choose to display the picture while doing the puzzle.
Picture
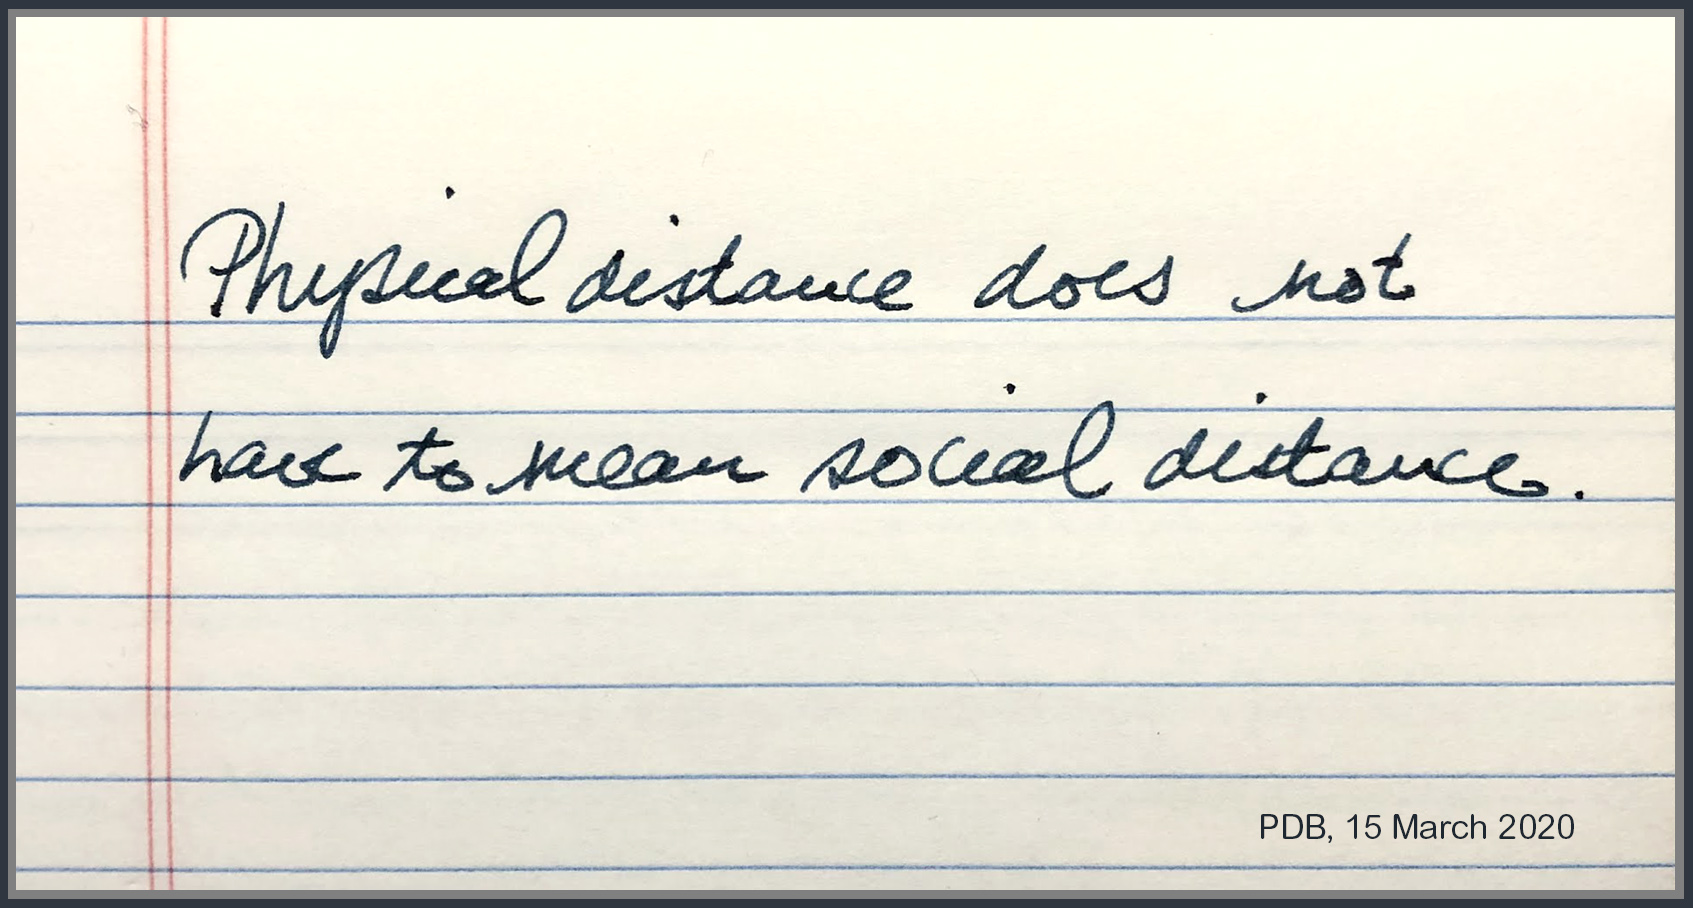
– Heard over the weekend, and resonates for many, I expect.
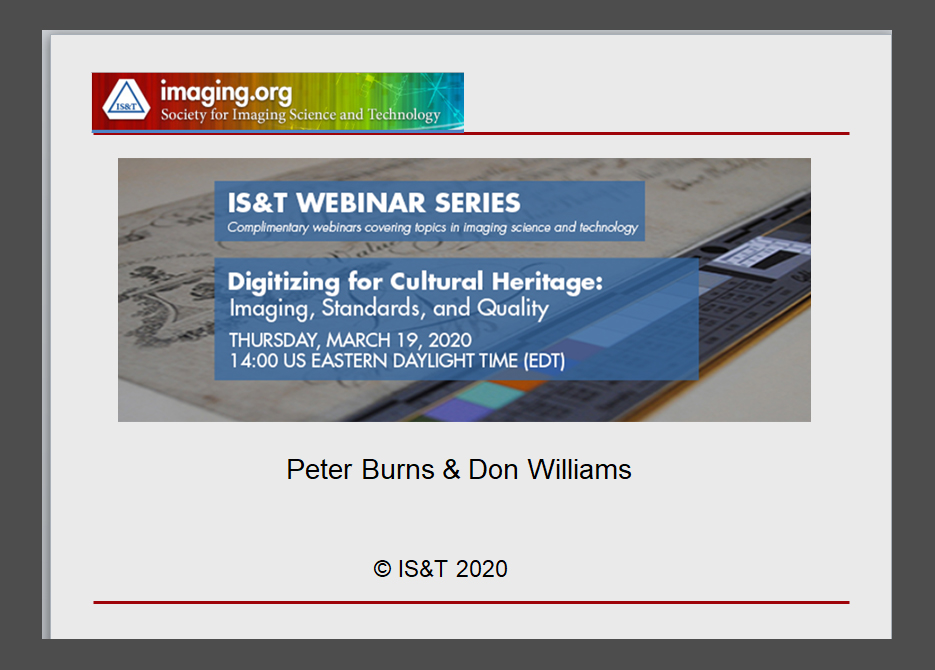
Last week, Don Williams and I presented a webinar for IS&T. We were asked to provide the presentation file.
Presentation material here
For all who need to navigate English. Recently I found myself hearing the term social distancing and thinking, ‘shouldn’t we be saying physical distancing?’ Not being an epidemiologist, but being an occasional technical writer, social distancing seemed to be an example of a trendy term for a well-established idea. I even went so far as to use ‘physical distancing’ in conversations.
Social Distancing is an established term for the actions intended to stop or slow down the spread of contagious diseases. It is most effective when the infection can be transmitted via droplet contact, direct physical contact, indirect physical contact, etc.
So, keeping a good physical distance from others is recommended. However, I find no use of the term physical distancing. Not sure why.
How about social distance? Since social distancing is well established, one might be forgiven for thinking that social distance is what we want to achieve. Not so fast!
Social distance describes the ‘distance’ between different groups in society, such as social class, race/ethnicity, etc, particularly when groups mix less than members of the same group [1]. In other words, it is the extent to which individuals or groups are removed from or excluded from participating in one another’s lives [2].
OK, that cleared that up for me. Let’s try to assure that social distancing does not lead to increased social distance between us.
[1] Social distance, Wikipedia
[2] Social distance, Dictionary.com